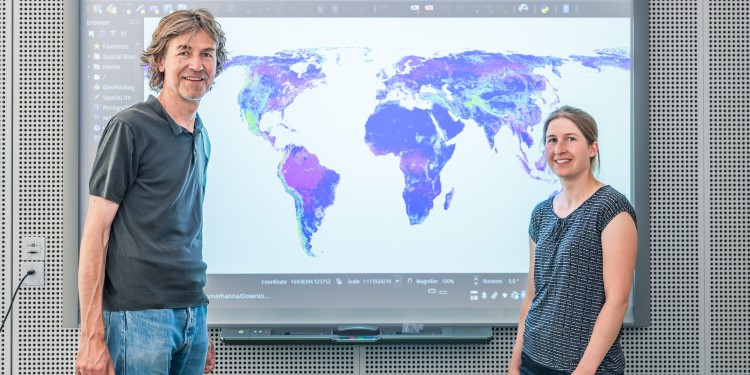
Reviewing the quality of global environmental maps
It could be so simple: producing global maps for vegetation, climate or soil at the touch of a button. Whether in Africa, America or Europe; whether up in the mountains or deep in the forest. No laborious on-site fieldwork would be necessary, nor would days spent evaluating data in a lab. Simply “train” the computer system to provide, as accurately as possible, predictions for any and every environmental variable. “Over the past few years, machine learning algorithms have become the most popular tool for modelling as they are able to identify non-linear, complex correlations,” explains Prof. Hanna Meyer from the Institute of Landscape Ecology at the University of Münster. Well-known examples include the worldwide potential for restoring tree populations or the status of species of plants on the so-called Red List.
However, the flood of publications of global environmental maps in the recent past has given rise to both excitement and criticism. Together with her colleague Prof. Edzer Pebesma from the Institute of Geoinformatics at Münster University, Hanna Meyer points out the uncertainties and limitations thrown up by the algorithms. “A simple presentation of so-called predictive values in the form of global maps is often incompatible with the idea of scientific reliability,” says Pebesma. “When using these maps – and especially in showing new protected areas – prediction errors must always be taken into account.”
In the case of global forecast maps, models are drawn up based on reference data from field samples. Experts then train a machine learning model, which learns to correlate satellite-based environmental information with reference data. The model thus trained is applied to global satellite data sets to produce a global map with the predicted values for the target variables. However, reference data are often available only in a limited form, as well as being unevenly distributed spatially, which means that they seldom provide complete information on continents and climate zones.
Over the past few years, a lot of energy has been invested in software development to keep applications simple for users. But there are many pitfalls. “If a global map isn’t equipped with understandable information regarding its reliability, it can easily be misused,” says Pebesma on the weak points. “Complete data sets for our environment do not exist, and no computer can automatically produce them.” One suggestion the scientists make is to “grey out” the areas in which the environment deviates too much from the training data and, as a result, neither meaningful predictions can be expected, nor any assessments made regarding their quality.
An example: when scientists model global patterns of biodiversity, and they have only reference data from Central Europe and North America to draw on, then the model gets no information from which it can learn something about contexts in tropical forests. “We know from ecological studies,” says Hanna Meyer, “that the patterns and the contexts deviate from one another. It doesn’t therefore make much sense, from an ecological point of view, to use such models to produce global maps. That’s actually self-evident, but it’s largely ignored in research practice.”
The researchers recently published their results in the form of a commentary in the “Nature Communications” journal and triggered a discussion. “We hope that in future the role of machine learning applications will be methodically reviewed in the production of global maps,” says Meyer. “We advocate that the uncertainties of the predictions should be handled in a critical and transparent way.”
Author: Kathrin Kottke
This article was first published in the University newspaper “wissen|leben” No. 5, July 6th 2022
