|
|
|
Free Neuropathology 5:2 (2024) |
|
Opinion Piece |
|
Pituitary adenoma classification: Tools to improve the current system |
|
William Charles McDonald |
|
Allina Health Laboratories – Abbott Northwestern Hospital, Minneapolis, MN 55407, USA |
|
Corresponding author: |
|
Additional resources and electronic supplementary material: supplementary material |
|
Submitted: 12 December 2023 |
|
Keywords: Pituitary, Classification, Machine learning, Statistical learning |
|
Abstract The World Health Organization classification of pituitary tumors provides a framework for pathologists and researchers to classify pituitary adenomas. From the perspective of a practicing pathologist, this classification can be improved by pooling immunohistochemical data in a more standardized way, and by deliberately distinguishing features that assist in classification from those that do not. This article illustrates one general workflow to examine classification features consisting of immunohistochemical stains for anterior pituitary tumors, in order to promote debate and advance an evidence-based framework for classification. |
|
Introduction: opportunities for improvement Every pathologist spends their career building or adapting tools to better characterize the diseases encountered in their practice. For neoplasms, this often begins by becoming familiar with the microscopic spectrum of the disease, the demographics of commonly affected individuals, and common clinical presentations. Consciously or unconsciously, we build a list of features that we find useful in classifying a disease, and then move on to refine the classification or provide additional prognostic or predictive information. To use personal experience alone in the diagnosis of disease is treacherous, since neoplasms overlap in appearance and human judgement is fraught with various cognitive biases (1). Generalizations and simple heuristics can be helpful, but data are necessary to test our assumptions and to develop better tools for classification. Ideally, the World Health Organization (WHO) 5th Edition pituitary tumor classification (2) would provide pathologists with a solid evidence-based classification to aid in diagnosis. However, the current system has several shortcomings that hinder its ability to accurately and reproducibly classify pituitary adenomas, including:
Before I go further, let me address the unnecessarily prominent role in pituitary tumor conversations that nomenclature occupies these days. I agree with Ho et al. (9) that a compelling case for "pituitary neuroendocrine tumor" (PitNET) has not been made, despite the prominence of its advocates. As it is still permissible to use the term "pituitary adenoma" according to the 5th edition of the WHO classification (2), I do so, and beg forgiveness from passionate adherents to the PitNET label. In any event, such academic debates are less substantial than deficits in the WHO classification of pituitary tumors, and distract from more important concerns. Improving the WHO classification It would be a disservice to register these criticisms without offering some means of improvement. Better methods are available, and are already employed, for instance by the architects of DNA methylation profiling, which has now spread from its origins in Germany to laboratories in the rest of the world, including North America. It’s not an overstatement to say that methylation profiling has radically revised our understanding of central nervous system tumor classification, and is poised to do so for tumors arising in other systems. Yet before we abandon our current strategy for pituitary adenoma classification using IHC in favor of methylation profiling, I think that two key lessons can be extracted from the methylation profiling experience in order to improve our IHC-based approach. Firstly, any attempt to establish a classification system requires the registration and comparison of large numbers of cases including all relevant classes of tumor. Methylation profiling could not have been successful without assembling large numbers of cases. As in methylation profiling efforts, cases need to be assembled into repositories that include all relevant tumor classes; this is the opposite of the current common practice of publishing limited, highly biased series designed to illustrate but not to test a classification or classification variable. Secondly, diagnostic features that are useful in classification must be chosen and applied uniformly throughout the registry. Indeed, authors of the WHO pituitary tumor classification seem to sense this, and recommend performing the "complete panel of stains" (presumably, all possible IHC that might relate to pituitary adenoma diagnosis) during the routine evaluation of pituitary adenomas (10). Nonetheless, data derived from the "complete panel of stains" are almost never provided in supporting literature, which tends to consist of reviews or biased collections of rare tumor types and upon individual classification variables, without documentation of other tests performed to corroborate the conclusions. Claims by WHO authors pertaining to IHC for alpha subunit and GATA3 are especially concerning in their lack of context and/or low numbers of published cases. One possible workflow to address the noted challenges, which incorporates these lessons from methylation profiling, is provided here as an illustration, using data from cases previously published. Case selection, recording of pre-operative data, tissue microarray (TMA) construction, IHC, and scoring were performed as previously described (11, 12). In addition to previously reported stains, we also performed IHC for GATA3 (HG3-31 (sc-268), Santa Cruz Biotech, 1:100 dilution) and IHC for estrogen receptors (alpha) (SP1, Thermo Scientific, 1:160 dilution). In brief, 157 pituitary adenomas from Allina Health (n = 136) and the University of Pennsylvania (n = 21) were incorporated into TMA’s and stained with the indicated IHC. IHC was scored in a blinded fashion using the Allred method (13), and adenoma class was assigned based upon median IHC scores, using clinical and serological data to confirm the classification. A simplified managerial class was assigned to facilitate analysis, but this class did not supervise the machine learning process. Estimating correlation between classification variables To start our thought experiment, classification variables should be distinguished from other descriptive variables and explicitly stated. This helps to establish limits on the classification problem, and allows more refined discussion of diagnostic algorithms. It is also an essential step in establishing relationships among these variables. In our work, the "complete panel of stains" (that is, the classification variables) consists of IHC for SF1, PIT1, TPIT, GATA3, alpha subunit, luteinizing hormone (LH), follicle-stimulating hormone (FSH), prolactin, thyroid-stimulating hormone (TSH), growth hormone, estrogen receptor, cytokeratin CAM5.2, and adrenocorticotropic hormone (ACTH). When one considers our series of pituitary adenomas (11, 14), correlation among variables is readily shown in a matrix (Figure 1).
Figure 1. Correlation matrix comparing immunohistochemical stains, ordered using hierarchical clustering. Correlation coefficient is displayed. Abbreviations: ACTH, adrenocorticotropic hormone; ASU, alpha subunit; CAM 5.2, cytokeratin CAM 5.2; ER, estrogen receptor; FSH, follicle-stimulating hormone; GH, growth hormone; LH, luteinizing hormone; SF1, steroidogenic factor 1; TPIT, T-box transcription factor; TSH, thyroid-stimulating hormone. It's easy to see that the variables that one might use for classifying pituitary adenomas are variably correlated with one another, exactly as one should expect. Practical problems arise for the pathologist, however, in considering which variables to use when trying to classify an adenoma. Incorporating redundant and correlated classification variables with inferior test performance reduces the usefulness of a classification algorithm and falsely bolsters the confidence of the diagnostician (1). Put another way, adding redundant and correlated variables that hope to resolve cases into groups leads to a classification system that produces overfitting and a classification process that generates expensive and distracting false positives and false negatives. This is a statistical truism, but seems to be forgotten by many pathologists. In concrete terms, when the authors of the WHO endocrine pituitary tumor classification recommend that "the complete panel of stains" be performed on all pituitary adenomas, they promote a classification system that overfits the data and reduces reproducibility while at the same time generating expensive, wasteful, and distracting false positives and false negatives in laboratories worldwide. Establishing context: observing multi-variable relationships among classification variables It has never been easier to move beyond simple correlations to show broader, multi-variable relationships using widely available, free statistical software (15, 16). Of the 157 pituitary adenomas in our series (11, 14), the relationships between classification variables, demographics, and tumor size can be readily illustrated in a so-called heatmap (Figure 2).
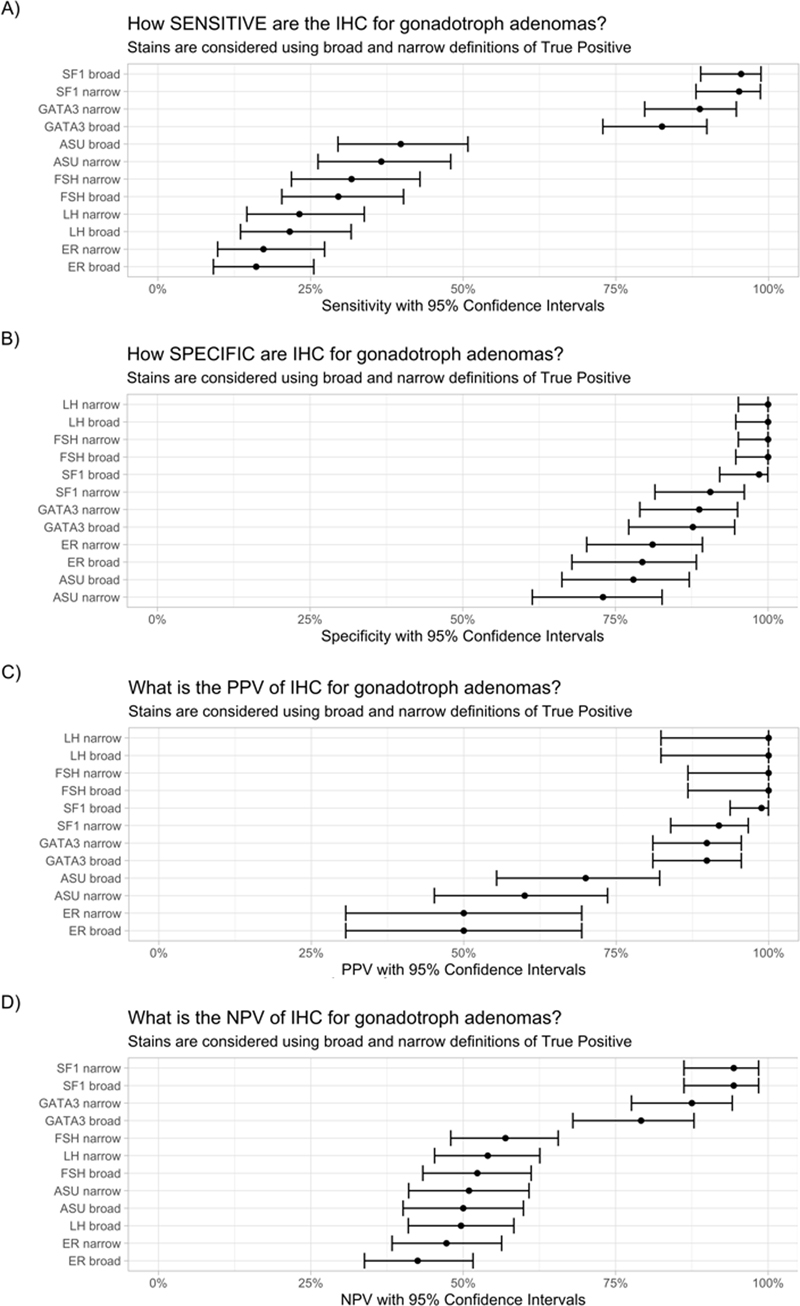
Figure 2. The figure shows a heatmap of median IHC scores (Allred scores) from 157 pituitary adenomas with annotation for managerial diagnoses (at top), tumor size, patient sex, and patient age (at bottom). Alpha subunit staining and CAM5.2 pattern are included in the annotation, but are not used for clustering. Columns represent individual cases. Rows of the heatmap represent Allred scores for the IHC indicated to the right, and range from 0 (no staining) to 8 (strong staining in greater than 2/3 of the cells); gray boxes indicate missing data. Abbreviations: ACTH, adrenocorticotropic hormone; CAM 5.2, cytokeratin CAM 5.2; ER, estrogen receptor; FSH, follicle-stimulating hormone; GH, growth hormone; LH, luteinizing hormone; SF1, steroidogenic factor 1; TPIT, T-box transcription factor; TSH, thyroid stimulating hormone. The advantage of such clustered displays is that they illustrate many relationships within the context of other potentially important variables. For instance, the extent to which GATA3 immunoreactivity is restricted to one or another group of adenomas in this collection of tumors can be estimated at a glance. Figure 2 shows, for example, that GATA3 immunoreactivity is observed in a subset of corticotroph adenomas, as observed by Ricklefs et al. (7); conversely, we do not find PIT1 family members with strong GATA3 immunoreactivity in our series, although Mete et al. have reported this in limited numbers (5). Likewise, a group of SF1-immunoreactive/PIT1-immunoreactive tumors, possibly of the sort described by Asa et al. (17), is readily found. Unlike most of the works cited by the current WHO classification, however, the immunohistochemical and demographic context of these tumors is apparent. This context is vital to establishing an evidence-based classification as well as for developing sensible diagnostic algorithms in individual laboratories. Only when classification variables are tabulated can the difficult work of estimating test characteristics occur. These test characteristics allow us to select a combination of tests that maximize accuracy and minimize wasteful complexity. Estimating test performance: sensitivity and specificity Using the data we tabulated for the classification variables, we may now estimate test characteristics. Generally, we think in terms of sensitivity and specificity. These are surprisingly nuanced ideas, even for those who have worked in pathology for many years. Sensitive to what? Specific for what? These two questions are often left unstated, leading to much confusion. The answers to these questions determine the parameters of the calculations performed and constrain the uses of any test. The goal of a test can greatly alter its usefulness (that is, its positive predictive value and negative predictive value). To consider the sensitivity of a test, it is equivalent to ask "What is true positive (TP) and how well does the test capture all cases of the disease in question?" For specificity, the equivalent question is "What is true negative (TN) and how well does the test capture all cases that should not be classified as the disease in question?". Definitions of what constitutes TP or TN can be made more narrowly (for instance, assuming that SF1 immunoreactivity is only TP when identifying gonadotroph adenomas) or more broadly (for instance, including SF1 immunoreactivity in multilineage pituitary tumors, as well as gonadotrophs). This mental exercise is applied to each classification variable. Why go through the trouble of such mental gymnastics for each classification variable? In short, because it permits the estimation and comparison of test characteristics and, importantly, their confidence intervals (CI). Figures 3-5 show the results when such a thought experiment is applied to the classification variables considered above. Figure 3 might be considered when deciding what stains are the most appropriate for the classification of a gonadotroph adenoma. Each stain is considered under narrow (TP = gonadotrophs) or broad (TP = gonadotrophs or plurihormonal tumors) assumptions, with positive immunoreactivity defined as median Allred score greater than 4 for all immunostains except LH and FSH, where a lower cutoff of greater than 2 was selected in recognition of the frequently more limited proportion of tumor cells expressing LH or FSH in gonadotroph adenomas.
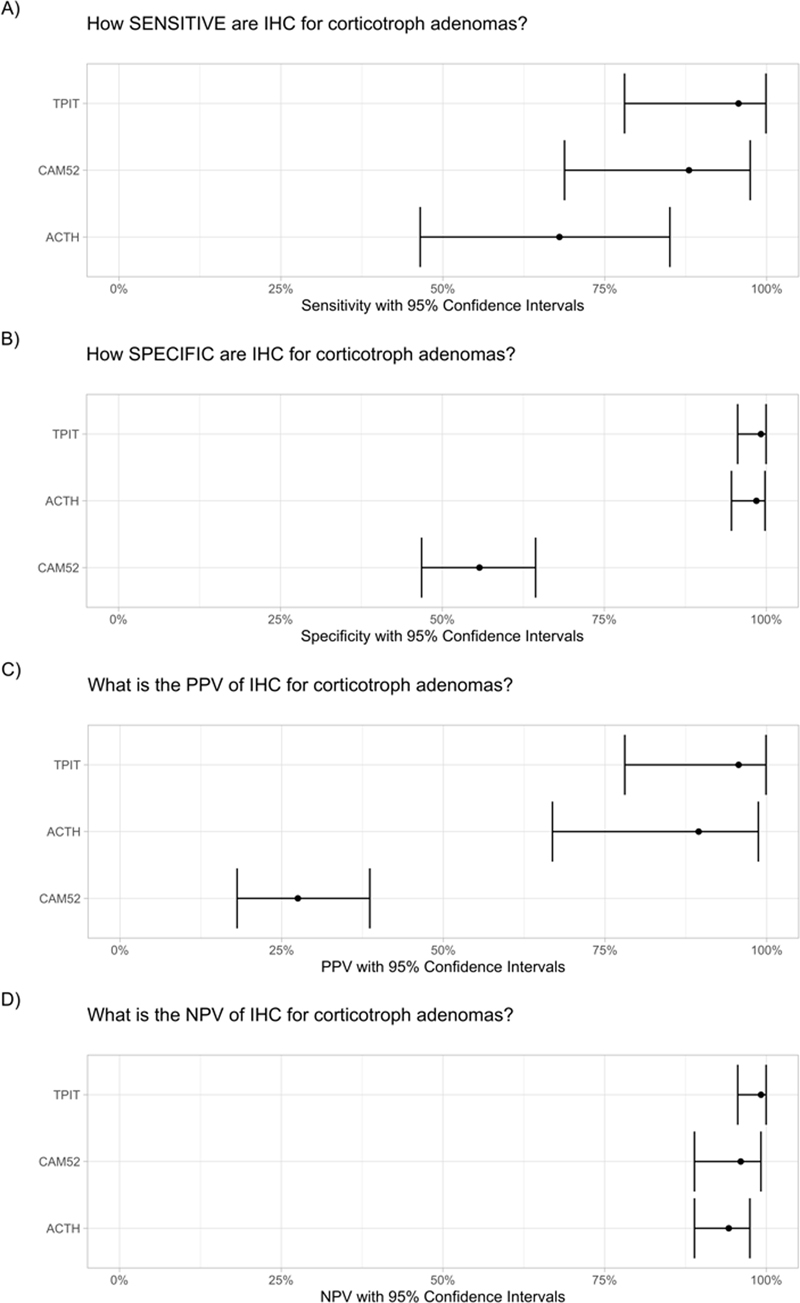
Figure 3. Test characteristics and 95% CI of immunohistochemical stains pertinent to the SF1 family of tumors using restrictive (narrow) or inclusive (broad) definitions of true positivity. Abbreviations: IHC, immunohistochemistry; PPV, positive predictive value; NPV, negative predictive value. Positive immunoreactivity was defined as a median Allred score greater than 4 for all markers, except LH and FSH, where a median Allred score greater than 2 was interpreted as positive. In our hands, SF1 IHC enjoys better sensitivity than other markers, while LH and FSH IHC have very high specificity, but low sensitivity, even when criteria for immunopositivity are relaxed. Others have reported a similar pattern (18). In my laboratory, to perform IHC for LH and FSH in addition to IHC for SF1 is unnecessary for the majority of tumors, adding to complexity and cost, without providing additional value, at least within an initial panel of immunostains. For the corticotroph lineage, both silent and functional corticotroph adenomas were accepted as TP, and estimates are made without broad or narrow conditions. Figure 4 shows that in our hands IHC for the transcription factor TPIT outperforms ACTH, showing greater sensitivity and comparable specificity. Figure 4 also shows that the negative predictive value of CAM5.2 is quite high, suggesting that when one encounters an adenoma that lacks CAM5.2 immunoreactivity, it is unlikely to be a corticotroph adenoma. Personal experience suggests (data not shown), that TPIT IHC is much easier to interpret than ACTH, which in our laboratory is never as clearly and darkly staining as TPIT.
Figure 4. Test characteristics and 95% CI of immunohistochemical stains pertinent to the TPIT family of tumors. Abbreviations: IHC, immunohistochemistry; PPV, positive predictive value; NPV, negative predictive value. Positive immunoreactivity was defined as a median Allred score greater than 4 for all markers. Finally, most pathologists would agree that the PIT1 lineage represents the most complicated and diagnostically thorny part of the WHO pituitary adenoma classification. Figure 5 shows estimated test characteristics for IHC that target PIT1 lineage and offers several important insights. Among the most obvious features is the dependence of a test on the number of data points available. TSH IHC sensitivity, for instance (Figure 5, panel A), shows very wide confidence intervals largely due to the paucity of cases with positive results. Given the heterogeneity of the PIT1 family, and the relatively porous boundaries between PIT1 family member IHC results, the mere exercise of deciding "what is true positive" is worthwhile. Except for PIT1 itself, where all PIT1 classes are accepted as TP, I’ve undertaken to show broad and narrow definitions of TP and TN in Figure 5, but acknowledge the inherent difficulty in such an exercise, especially given the paucity of prevalence estimates for some of the rarer adenoma classes, and the current ambiguity in classification guidelines.
Figure 5. Test characteristics and 95% CI of immunohistochemical stains pertaining to PIT1 family of tumors using restrictive (narrow) or inclusive (broad) definitions of true positivity. Abbreviations: IHC, immunohistochemistry; PPV, positive predictive value; NPV, negative predictive value. Positive immunoreactivity was defined as a median Allred score greater than 4 for all markers. Armed with this these estimates, I am now able to make more informed choices about which stains to use in a diagnostic algorithm for my practice. The workup of a pituitary adenoma in my laboratory currently entails careful documentation of available clinical, radiological, and serological information. All pituitary adenomas are examined using a panel of IHC including SF1, PIT1, and TPIT. For nonfunctional adenomas, this panel resolves most macroadenomas into the gonadotroph adenoma class without the need for additional IHC. In the setting of Cushing disease, or when a nonfunctional adenoma is found to be TPIT immunoreactive, I add IHC for ACTH and cytokeratin CAM5.2 to the initial panel. In the setting of acromegaly or significant hyperprolactinemia, in addition to SF1, PIT1, and TPIT IHC we also perform IHC for prolactin, growth hormone, TSH, estrogen receptor, and GATA3 in the initial panel. Finally, when clinical findings or initial IHC are ambiguous, a liberal approach is used, with the "complete panel of stains" being necessary in only a minority of cases. The approach related above resembles in some ways the efforts by Neou et al. (19) to build a pituitary adenoma classification, but restricts itself to readily available IHC. Although simple immunohistochemical stain scores are illustrated here, other potential classification variables, including molecular features or categorical variables like ultrastructural findings, would also profit from such interrogation. One day the use of methods such as multiple factor analysis (19) might allow incorporation of various disparate variables into a single model. We might finally be able to estimate the usefulness of molecular, serological, demographic, immunohistochemical, and ultrastructural variables within a common context. The strengths of our approach include the blinded review of IHC prior to interpretation by a pathologist and that our series includes tumors commonly encountered in the community. Weaknesses include limited clinical follow-up following resection, paucity of rare tumor types, and underrepresentation of microadenomas (necessitated by study design, which employed TMA’s with four cores per adenoma). The classification lifecycle: provisional models As the British statistician George Box once noted, "All models are wrong, some are useful". Tests and classifications come and go. In this sense, all classifications are provisional (20) and our collective task is simply to improve the current draft of the classification. I’m optimistic that clearly stated classification variables, attention to correlation, joint registry of a wide range of cases rather than subsets of rare adenoma types, and attention to test performance would generate a more useful, transparent, and reproducible classification of pituitary adenomas. For the practicing pathologist, this would be invaluable. An appendix of the immunohistochemical data and basic characteristics of our series are provided in Supplement 1 in order that others may provide their own definitions of true positive and true negative in the calculation of test characteristics, to compare our series with their own, and to draw their own conclusions. References 1. Tversky A, Kahneman D. Judgment under uncertainty: heuristics and biases. Science. 1974;185(4157):1124-31. DOI: https://doi.org/10.1126/science.185.4157.1124. 2. WHO Classification of Tumours Editorial Board. Endocrine and neuroendocrine tumours [Internet]. Lyon (France): International Agency for Research on Cancer; 2022 [cited 2022 Aug 9]. (WHO classification of tumours series, 5th ed.; vol. 10). Available from: https://tumourclassification.iarc.who.int/chapters/53. 3. Obari A, Sano T, Ohyama K, Kudo E, Qian ZR, Yoneda A, et al. Clinicopathological features of growth hormone-producing pituitary adenomas: difference among various types defined by cytokeratin distribution pattern including a transitional form. Endocr Pathol. 2008;19(2):82-91. DOI: https://doi.org/10.1007/s12022-008-9029-z. 4. Mete O, Gomez-Hernandez K, Kucharczyk W, Ridout R, Zadeh G, Gentili F, et al. Silent subtype 3 pituitary adenomas are not always silent and represent poorly differentiated monomorphous plurihormonal Pit-1 lineage adenomas. Mod Pathol. 2016;29(2):131-42. DOI: https://doi.org/10.1038/modpathol.2015.151. 5. Mete O, Kefeli M, Caliskan S, Asa SL. GATA3 immunoreactivity expands the transcription factor profile of pituitary neuroendocrine tumors. Mod Pathol. 2019;32(4):484-9. DOI: https://doi.org/10.1038/s41379-018-0167-7. 6. Hickman RA, Bruce JN, Otten M, Khandji AG, Flowers XE, Siegelin M, et al. Gonadotroph tumours with a low SF-1 labelling index are more likely to recur and are associated with enrichment of the PI3K-AKT pathway. Neuropathol Appl Neurobiol. 2021;47(3):415-27. DOI: https://doi.org/10.1111/nan.12675. 7. Ricklefs FL, Fita KD, Rotermund R, Piffko A, Schmid S, Capper D, et al. Genome-wide DNA methylation profiles distinguish silent from non-silent ACTH adenomas. Acta Neuropathol. 2020;140(1):95-7. DOI: https://doi.org/10.1007/s00401-020-02149-3. 8. Horvath E, Kovacs K, Singer W, Smyth HS, Killinger DW, Erzin C, et al. Acidophil stem cell adenoma of the human pituitary: clinicopathologic analysis of 15 cases. Cancer. 1981;47(4):761-71. DOI: https://doi.org/10.1002/1097-0142(19810215)47:4<761::aid-cncr2820470422>3.0.co;2-l. 9. Ho KKY, Fleseriu M, Wass J, van der Lely A, Barkan A, Giustina A, et al. A tale of pituitary adenomas: to NET or not to NET: Pituitary Society position statement. Pituitary. 2019;22(6):569-73. DOI: https://doi.org/10.1007/s11102-019-00988-2. 10. Asa SL, Mete O, Perry A, Osamura RY. Overview of the 2022 WHO Classification of Pituitary Tumors. Endocr Pathol. 2022;33(1):6-26. DOI: https://doi.org/10.1007/s12022-022-09703-7. 11. McDonald WC, Banerji N, McDonald KN, Ho B, Macias V, Kajdacsy-Balla A. Steroidogenic factor 1, Pit-1, and adrenocorticotropic hormone: a rational starting place for the immunohistochemical characterization of pituitary adenoma. Arch Pathol Lab Med. 2017;141(1):104-12. DOI: https://doi.org/10.5858/arpa.2016-0082-OA. 12. Wang A, Gill A, Martinez-Lage M. Expression of GATA-3 in human pituitary adenomas and other sellar and parasellar neoplasms. American Association of Neuropathologists, Inc; June 18, 2016; Baltimore: J Neuropathol Exp Neurol; 2016. p. 615. 13. Allred DC, Harvey JM, Berardo M, Clark GM. Prognostic and predictive factors in breast cancer by immunohistochemical analysis. Mod Pathol. 1998;11(2):155-68. 14. McDonald WC, McDonald KN, Helmer JA, Ho B, Wang A, Banerji N. The role of T-box transcription factor in a pituitary adenoma diagnostic algorithm. Arch Pathol Lab Med. 2021;145(5):592-8. DOI: https://doi.org/10.5858/arpa.2020-0091-OA. 15. Posit Team. RStudio: Integrated Development Environment for R. Boston, MA: Posit Software, PBC; 2023. 16. R Core Team. R: A Language and Environment for Statistical Computing. Vienna, Austria: R Foundation for Statistical Computing; 2023. 17. Asa SL, Mete O, Riddle ND, Perry A. Multilineage pituitary neuroendocrine tumors (PitNETs) expressing PIT1 and SF1. Endocr Pathol. 2023;34(3):273-8. DOI: https://doi.org/10.1007/s12022-023-09777-x. 18. Mete O, Cintosun A, Pressman I, Asa SL. Epidemiology and biomarker profile of pituitary adenohypophysial tumors. Mod Pathol. 2018;31(6):900-9. DOI: https://doi.org/10.1038/s41379-018-0016-8. 19. Neou M, Villa C, Armignacco R, Jouinot A, Raffin-Sanson ML, Septier A, et al. Pangenomic classification of pituitary neuroendocrine tumors. Cancer Cell. 2020;37(1):123-34 e5. DOI: https://doi.org/10.1016/j.ccell.2019.11.002. 20. Louis DN. A vade mecum for crossing the second translational "valley of death" in brain tumor classification. Brain Pathol. 2023:e13183. DOI: https://doi.org/10.1111/bpa.13183.
Copyright: © 2024 The author(s). This is an open access article distributed under the terms of the Creative Commons Attribution 4.0 International License (https://creativecommons.org/licenses/by/4.0/), which permits unrestricted use, distribution, and reproduction in any medium, provided the original author and source are credited, a link to the Creative Commons license is provided, and any changes are indicated. The Creative Commons Public Domain Dedication waiver (https://creativecommons.org/publicdomain/zero/1.0/) applies to the data made available in this article, unless otherwise stated. |