|
|
||||||||||||||||||||||||||||||||||||||||||||||||||||||||||||||||||||||||||||||||||||||||||||||||||||||||||||||||||||||||||||||||||||||||||||||||||||||||||||||||||||||||||||||||||||||||||||||||||||||||||||||||
|
Free Neuropathology 4:19 (2023) |
||||||||||||||||||||||||||||||||||||||||||||||||||||||||||||||||||||||||||||||||||||||||||||||||||||||||||||||||||||||||||||||||||||||||||||||||||||||||||||||||||||||||||||||||||||||||||||||||||||||||||||||||
|
Original Paper |
||||||||||||||||||||||||||||||||||||||||||||||||||||||||||||||||||||||||||||||||||||||||||||||||||||||||||||||||||||||||||||||||||||||||||||||||||||||||||||||||||||||||||||||||||||||||||||||||||||||||||||||||
|
Reference on copy number variations in pleomorphic xanthoastrocytoma: Implications for diagnostic approach |
||||||||||||||||||||||||||||||||||||||||||||||||||||||||||||||||||||||||||||||||||||||||||||||||||||||||||||||||||||||||||||||||||||||||||||||||||||||||||||||||||||||||||||||||||||||||||||||||||||||||||||||||
|
David E. Reuss1,2, Daniel Schrimpf1,2, Damian Stichel1,2, Azadeh Ebrahimi3, Chris Dampier4, Kenneth Aldape4, Matija Snuderl5, David Capper6, Martin Sill7,8, David T. W. Jones8,9, Stefan M. Pfister2,8,10, Felix Sahm1,2,8, Andreas von Deimling1,2,8 |
||||||||||||||||||||||||||||||||||||||||||||||||||||||||||||||||||||||||||||||||||||||||||||||||||||||||||||||||||||||||||||||||||||||||||||||||||||||||||||||||||||||||||||||||||||||||||||||||||||||||||||||||
|
||||||||||||||||||||||||||||||||||||||||||||||||||||||||||||||||||||||||||||||||||||||||||||||||||||||||||||||||||||||||||||||||||||||||||||||||||||||||||||||||||||||||||||||||||||||||||||||||||||||||||||||||
|
Corresponding author: |
||||||||||||||||||||||||||||||||||||||||||||||||||||||||||||||||||||||||||||||||||||||||||||||||||||||||||||||||||||||||||||||||||||||||||||||||||||||||||||||||||||||||||||||||||||||||||||||||||||||||||||||||
|
Additional resources and electronic supplementary material: supplementary material |
||||||||||||||||||||||||||||||||||||||||||||||||||||||||||||||||||||||||||||||||||||||||||||||||||||||||||||||||||||||||||||||||||||||||||||||||||||||||||||||||||||||||||||||||||||||||||||||||||||||||||||||||
|
Submitted: 19 October 2023 |
||||||||||||||||||||||||||||||||||||||||||||||||||||||||||||||||||||||||||||||||||||||||||||||||||||||||||||||||||||||||||||||||||||||||||||||||||||||||||||||||||||||||||||||||||||||||||||||||||||||||||||||||
|
Keywords: Pleomorphic Xanthoastrocytoma, PXA, Copy Number Variations, CNV, Methylation, Classification, 7/10 signature, EGFR, CDKN2A/B, Amplification, Homozygous deletion |
||||||||||||||||||||||||||||||||||||||||||||||||||||||||||||||||||||||||||||||||||||||||||||||||||||||||||||||||||||||||||||||||||||||||||||||||||||||||||||||||||||||||||||||||||||||||||||||||||||||||||||||||
|
Abstract Pleomorphic xanthoastrocytoma (PXA) poses a diagnostic challenge. The present study relies on methylation-based predictions and focuses on copy number variations (CNV) in PXA. We identified 551 tumors from patients having received the histologic diagnosis or differential diagnosis pleomorphic xanthoastrocytoma (PXA) uploaded to the web page www.molecularneuropathology.org. Of these 551 tumors, 165 received the prediction “methylation class (anaplastic) pleomorphic xanthoastrocytoma” with a calibrated score >=0.9 by the brain tumor classifier version v12.8 and, therefore, were defined the PXA reference set designated mcPXAref. In addition to these 165 mcPXAref, 767 other tumors received the prediction mcPXA with a calibrated score >=0.9 but without a histological PXA diagnosis. The total number of individual tumors predicted by histology and/or by methylome based classification as PXA, mcPXA or both was 1318, and these were designated the study cohort. The selection of a control cohort was guided by methylation-based predictions recurrently observed for the other 386/551 tumors diagnosed as histologic PXA. 131/386 received predictions for another entity besides PXA with a score >=0.9. Control tumors corresponding to the 11 most common other predictions were selected, adding up to 1100 reference cases. CNV profiles were calculated from all methylation datasets of the study and control cohorts. Special attention was given to the 7/10 signature, gene amplifications and homozygous deletion of CDKN2A/B. Comparison of CNV in the subsets of the study cohort and the control cohort were used to establish relations independent of histological diagnoses. Tumors in mcPXA were highly homogenous in regard to CNV alterations, irrespective of the histological diagnoses. The 7/10 signature commonly present in glioblastoma, IDH-wildtype, was present in 15-20% of mcPXA, whereas amplification of oncogenes (likewise common in glioblastoma) was very rare in mcPXA (<1%). In contrast, the histology-based PXA group exhibited high variance in regard to methylation classes as well as to CNVs. Our data add to the notion, that histologically defined PXA likely only represent a subset of the biological disease. |
||||||||||||||||||||||||||||||||||||||||||||||||||||||||||||||||||||||||||||||||||||||||||||||||||||||||||||||||||||||||||||||||||||||||||||||||||||||||||||||||||||||||||||||||||||||||||||||||||||||||||||||||
|
Introduction Since its first description in 1979 (1), pleomorphic xanthoastrocytoma (PXA) has posed a notable diagnostic challenge. Opinions on appropriate diagnostic parameters vary, resulting in debates on the defining characteristics of the entity itself as well as on the diagnosis of many individual tumors. The current WHO classification renders specific morphological features including pleomorphism, presence of multinucleated as well as spindle cells, xanthomatous cells and eosinophilic granular bodies as essential (2,3). Molecular alterations including BRAF mutation, homozygous deletion of CDKN2A/B and the methylome profile of PXA (mcPXA) are currently considered as desirable criteria for confirming a diagnosis. A major problem is that only a fraction of tumors receiving the prediction mcPXA do exhibit the classical morphological features of PXA (and conversely, many tumors histologically called PXA show molecular features typical of other entities). The central dispute revolves around the question, how tumors with a methylation profile of PXA lacking the histological hallmarks should be classified. Several studies have addressed this problem without coming to a consensus as for now (4-7). The present study has a very limited scope addressing only the three parameters: the initial histological diagnosis, the DNA methylation-based tumor prediction and copy number variations (CNVs). Thus, in 932 tumors with a Heidelberg classifier prediction of mcPXA, the only additional parameters addressed are initial diagnosis and CNVs. Conveniently, CNVs can be read out of array-based methylome data and allow for the determination of chromosomal losses and gains including gene amplifications and homozygous deletions. We determined the distribution of CNVs focusing on regions and genes known to be relevant in PXA and other morphological mimics. Based on the large number of datasets included, the conclusions can be considered very robust despite the intentional limitations on scope. Material and Methods Selection of study and control cohorts The basis for all tumors included in this study was presence of an Illumina HumanMethylation450 (450K) or EPIC dataset. There were 120800 tumors in the database of the Department of Neuropathology Heidelberg and German Cancer Research Center (DKFZ) containing data from the Heidelberg Brain Tumor Classifier (www.molecularneuropathology.org) (date: 01. Aug. 2023). Of these, 932 tumors were predicted as belonging to the methylation class pleomorphic xanthoastrocytoma (mcPXA) by the Heidelberg Brain Tumor Classifier version 12.8 with a calibrated score >= 0.9. Version 12.8 has been further developed from a previously published version 11b4 (8). In an independent query, we identified all tumors in the database for which the histological diagnosis or differential diagnosis PXA has been disclosed by the submitters. This yielded 551 tumors. One hundred and sixty-five tumors received both, the prediction of mcPXA and the diagnosis or differential diagnosis PXA and these were designated the mcPXA reference set (mcPXAref). Thus, the central study cohort included 1318 cases. A graphical depiction of the study cohort is provided in Figure 1. An overview of the classifier predictions for 551 histological PXA is given in supplementary table 1. All predictions with a calibrated score >=0.9 occurring at least twice were considered relevant differential molecular diagnoses of histological PXA. Reference sets of 100 corresponding tumors for each class were compiled for eleven differential diagnoses. All tumors in the reference sets received a prediction with a calibrated score >=0.9 in the brain tumor classifier V12.8. This resulted in a reference cohort totaling 1100 methylation datasets.
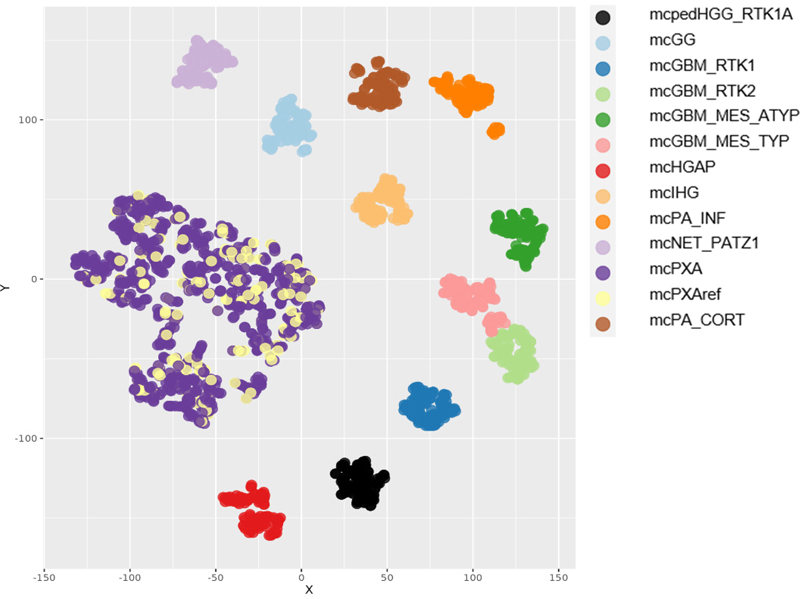
Figure 1: Graphical description of the study groups: Of 932 tumors receiving a classifier prediction (calibrated score >=0.9), 767 did not receive a histological PXA diagnosis and the latter were designated as mcPXA. 165 of the 932 also were diagnosed histologically as PXA (or PXA was in the differential diagnosis) and these were designated as mcPXAref. A control group containing 11 mc with 100 tumors each was selected based on the most frequent predictions in tumors histologically diagnosed as PXA but with other classifier predictions. The reference cohort included: mc Diffuse paediatric-type high grade glioma, RTK1 subtype, subclass A (mcpedHGG_RTK1A); mc Ganglioglioma (mcGG); mc Glioblastoma, IDH-wildtype, atypical mesenchymal type (mcGBM_MES_ATYP); mc Glioblastoma, IDH-wildtype, RTK1 subtype (mcGBM_RTK1); mc Glioblastoma, IDH-wildtype, RTK2 subtype (mcGBM_RTK2); mc Glioblastoma, IDH-wildtype, typical mesenchymal type (mcGBM_MES_TYP); mc High-grade astrocytoma with piloid features (mcHGAP); mc Infant-type hemispheric glioma (mcIHG); mc Infratentorial pilocytic astrocytoma (mcPA_INF); mc Neuroepithelial tumour with PATZ1 fusion (mcNET_PATZ1) and mc Supratentorial pilocytic astrocytoma (mcPA_CORT). Determination of CNV and summary CNV plots tSNE analyses were performed using the R-Package Rtsne (https://github.com/jkrijthe/Rtsne) employing the 20,000 most variable CpG sites according to standard deviation; 3000 iterations and a perplexity value of 10. CNV data were calculated from the output of the Illumina 450K or 850K/EPIC platforms. CNV plots are based on the raw data subjected to analysis by the ‘conumee’ R package in Bioconductor (https://www.bioconductor.org/packages/release/bioc/html/conumee.html). Assessment of copy-number alterations was automated using the results from conumee after additional baseline correction. Amplifications were called if the respective probes exhibited a value higher than 0,55 on a log2-scale. Homozygous deletions were called if the respective probes exhibited a value lower than -0.4 on a log2-scale. Statistics All data sets were collected retrospectively. Distribution of nominal data was tested employing Fisher’s exact test. Results Diagnoses in mcPXA Tumors with a mcPXA prediction but without a PXA diagnosis (n=767) received another diagnosis in 399 instances. No diagnosis was provided for 368 cases. Diagnoses were slightly simplified to allow for categorization. A list of given diagnoses is provided in supplementary table 2. tSNE of mc PXA, mcPXAref, and reference sets Using t-distributed stochastic neighbor embedding (t-SNE) we analyzed all tumors of the study cohort and reference sets (Figure 2). Tumors receiving the classifier prediction mcPXA were annotated according to presence (mcPXAref) or absence (mcPXA) of the histological diagnosis (or differential diagnosis) of PXA. Importantly, the distribution within mcPXA and mcPXAref is similar. This demonstrates that the morphological features defining histological PXA cannot readily single out a subpopulation within mcPXA associated with ‘canonical’ features.
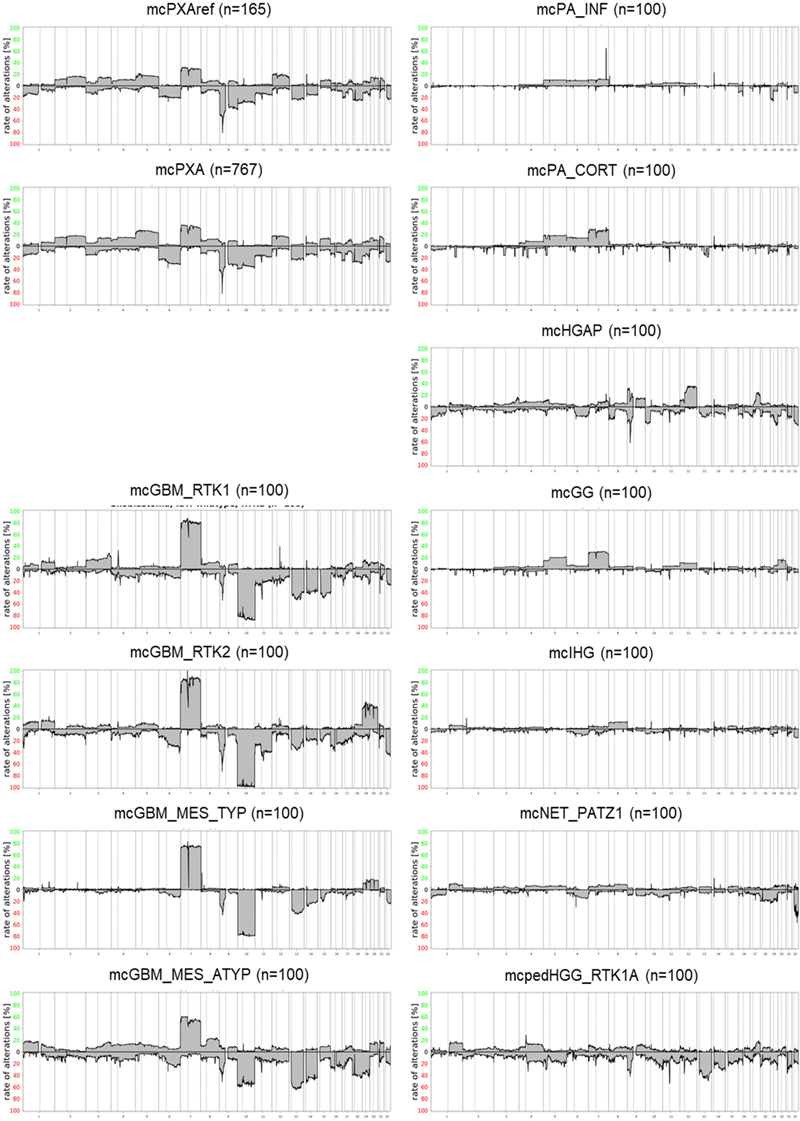
Figure 2: tSNE analysis of mcPXA, mcPXAref and reference sets. Tumors from the mcPXA and the mcPXAref cohorts cluster together and are separated from the reference sets. Summary CNV (sumCNV) plots of mcPXA, mcPXAref and reference sets For an overview, summary CNV (sumCNV) plots were generated for all cohorts. Tumors with the classifier prediction PXA were divided in two subgroups, depending on whether the histological (differential) diagnosis was PXA (mcPXAref, n=165) or another histological diagnosis or no diagnosis was given (mcPXA, n=767). SumCNV plots of mcPXAref and mcPXA were virtually identical, indicating that the presence or absence of the histological diagnosis PXA does not associate with the frequency of any CNV (Figure 3). The sumCNV profiles of the 11 reference sets of differential diagnoses were clearly distinct from the mcPXA and mcPXAref sumCNV profiles. Notable differences can be observed between the 4 glioblastoma IDH wildtype subgroups containing 100 samples each. Most evident was the highest proportion of the 7/10 signature and an increased incidence of trisomies of chromosomes 19 and 20 in GBM IDH wildtype RTK2. These differences will be followed up in larger cohorts. Summary CNV profiles are provided in Figure 3.
Figure 3: Summary CNV plots of mcPXA, mcPXAref and reference sets. Prevalence of the 7/10 signature in mcPXA, mcPXAref and reference sets Combined gain of chromosome 7 and loss of chromosome 10, dubbed 7/10 signature, is a very frequent molecular feature of glioblastoma. The best parameters for defining the 7/10 signature have not yet been established. In this study, a previously published algorithm has been employed (9). Presence of the 7/10 signature was scored if gain of at least 50% of the short or the long arm of chromosome 7 coincided with loss of at least 50% of the short or the long arm of chromosome 10. The 7/10 signature according to this guideline was not observed at all in Infant-type hemispheric glioma. Supratentorial pilocytic astrocytoma and Ganglioglioma typically exhibiting frequent gain of chromosome 7 (Figure 3) both presented with the 7/10 signature in 1% and 2% of the cases, respectively. Likewise, the 7/10 signature occurred in only 1% of Infratentorial pilocytic astrocytoma; however, this tumor group much more rarely exhibited chromosome 7 gains. Only 2% of Diffuse paediatric-type high grade glioma, RTK1 subtype, subclass A carried the 7/10 signature. Among the glioblastoma subtypes we detected a presumably nonrandom difference in the frequency of 7/10 signature ranging from 38% in mcGBMmes_atypical to 92% in GBM_RTK2. These differences will be followed up in a larger cohort of glioblastomas. Our study demonstrated the presence of the 7/10 signature in 24/165 (15%) mcPXAref and in 145/767 (19%) mcPXA. The difference in frequencies of the 7/10 signature in both groups was not significant (Fisher’s exact test p >0.29). The distribution of numerical alterations on the chromosomal arms 7 and 10 in mcPXAref, mcPXA and the 11 control groups is shown in table 1. Data for 2418 individual tumors are provided in supplementary table 3.
Table 1: Distribution of chromosomal 7 gains and 10 losses in mcPXA, mcPXAref and in reference sets Prevalence of the CDKN2A/B homozygous deletion and gene amplifications in mcPXA, mcPXAref and reference sets A hallmark chromosomal numerical alteration in PXA is a homozygous deletion on chromosomal arm 9p including the CDKN2A/B locus (7,10). This alteration was seen in 147/165 (89%) mcPXAref and in 685/767 (89%) mcPXA. Due to the high frequency of this alteration in GBM, PXA cannot be separated from GBM on these grounds. Again, we observed different frequencies of homozygous CDKN2A/B deletions in GBM subgroups, ranging from 40% in Glioblastoma, IDH-wildtype, mesenchymal to 79% in Glioblastoma, IDH-wildtype, RTK2. The differences likely are non-random and will be followed up. As expected, high-grade astrocytoma with piloid features exhibited a high proportion of homozygous CDKN2A/B deletions (80%). Gene amplifications affecting EGFR, MDM2 and PDGFRA were rare in mcPXA and PXA. Highest incidences for EGFR amplification were observed in Glioblastoma, IDH-wildtype, RTK2 (86%), for MDM2 amplification in Glioblastoma, IDH-wildtype, RTK1 (23%) and for PDGFRA amplification also in Glioblastoma, IDH-wildtype, RTK1 (18%). The distribution of homozygous CDKN2A/B deletions in mcPXAref, mcPXA and reference sets as well as the distribution for gene amplifications is given in table 2. Data for 2418 individual tumors are provided in supplementary table 4.
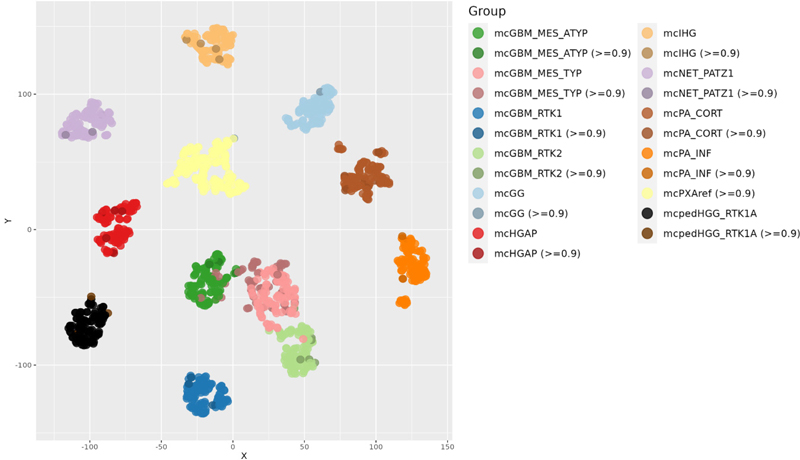
Table 2: Distribution of amplifications and homozygous CDKN2A/B deletions in mcPXA, mcPXAref and in reference sets Predictions in tumors diagnosed as PXA In the 551 tumors which received the diagnosis or differential diagnosis PXA, 296 tumors received a score >=0.9. Highest numbers for predictions (all scores / scores >= 0,9) were received for mcPXA (208/165), mcGBM_MES_TYP (108/59), mcPA_CORT (22/11), methylation class control tissue, reactive tumor microenvironment (mcCTRLmicro) (30/8), mcGBM_RTK2 (13/6), mcHGAP (15/5), mcIHG (5/4), mcGBM_RTK1 (4/3), mcPA_INF (3/3), mcNET_PATZ1 (4/3), methylation class Astrocytoma, IDH-mutant (mcAIDHmut) (3/2), mc Diffuse hemispheric glioma, H3 G34-mutant (DHGH3mut) (2/2), mcpedHGG_RTK1A (5/2), mcGG (12/2), mcGBM_MES_ATYP (17/2) and mc Malignant peripheral nerve sheath tumor (mcMPNST) (6/2). All predictions for the 551 tumors are listed in supplementary table 1. As expected, a substantial portion of tumors with a histological PXA diagnosis or suspicion received a prediction for glioblastoma. Surprising was the distribution among the four adult glioblastoma subclasses. The mcGBM_MES_TYP was predicted with high score in 62, mcGBM_MES_ATYP in 5, mcGBM_RTK2 in 6 and mcGBM_RTK1 in 3 tumors. This is suggestive of shared histological features of PXA with GBM belonging to the mcGBM_MES_TYP. PXA with predictions other than mcPXA and calibrated scores >0.9 clustered well with the respective reference groups (Figure 4). PXA with predictions other than mcPXA and calibrated scores <0.9 exhibited a scattered distribution (data not shown).
Figure 4: tSNE analysis of tumors diagnosed as PXA receiving a calibrated score >0.9, and reference sets. Tumors not receiving a mcPXA prediction cluster with the respective reference groups. Discussion One major weakness of the present study concerns the available data on histological diagnoses of the extended cohort (supplementary table 2). For 386/932 tumors with a mcPXA prediction no sufficiently specified diagnosis was given. Submitters of data to the webpage may have been inexperienced, may have been not overly motivated to provide the (optional) information or may have uploaded data prior to finalization of the diagnosis. The webpage serving as a basis for the study does not allow for submitting a revised version of the diagnosis upon completion of methylation analysis. A review of the diagnoses is unfortunately not possible. Therefore, we assume that many of the tumors which received a prediction mcPXA also would have received the histological classification PXA. This very large tumor series, however, allows drawing of two main conclusions: 399/932 tumors with a clear molecular pattern (DNA methylation and CNV profile) of PXA received a non-PXA histological diagnosis - suggesting a high morphological variance in mcPXA that precluded a histological PXA diagnosis in at least 43% and up to 82% of the cases (depending on scoring of the 386 tumors without a diagnosis at all). A conservative estimate would therefore estimate that ~50% of mcPXA will not be recognized by histology alone. The other conclusion is that the 165 tumors with both a PXA diagnosis as well as a mcPXA prediction is large enough for serving as a ‘standard’ reference set for subsequent comparisons with the 762 mcPXA not having received a PXA diagnosis. Tumors with mcPXA prediction are highly homogenous in respect to grouping upon tSNE analyses or CNV analyses independent of whether they were histologically diagnosed as PXA or as other tumors (Figures 2 and 3, tables 1 and 2). This includes all methylation patterns, gains and losses of chromosomal arms as well as circumscribed amplifications or homozygous deletions. In contrast, tumors diagnosed as PXA on histologic grounds alone were heterogeneous upon tSNE (Figure 4) and CNV analyses (supplementary tables 3 and 4). Histologically diagnosed PXA with non mcPXA classifier prediction exhibited copy number alterations corresponding to those seen in the respective methylation classes. This data constellation is compatible with a model assuming that a classifier-based approach predicting mcPXA is recognizing a tumor cohort more homogenous than a histology-based approach diagnosing PXA. Based on the high homogeneity of mcPXA and mcPXAref this study provides a stable framework for CNV alterations. This is of relevance for separating PXA from GBM. The 7/10 signature has been proposed by WHO as a surrogate marker for GBM diagnosis in absence of necrosis or microvascular proliferation. The present data demonstrate that the 7/10 signature is present in 15% to 20% of mcPXA, suggesting caution is advised when considering this as a sole marker. This must be balanced against the clear value of the 7/10 signature especially in tissue specimens from the tumor edges or from stereotactic biopsies in elderly patients. Amplifications of EGFR, MDM2 and PDGFRA occurred in 9/932 (< 1%) mcPXA (table 2). In contrast, gene amplifications are highly prevalent in GBM, although there appear to be methylation class specific differences in the frequency of distinct amplifications. The presence of these gene amplifications may be considered an argument against the diagnosis of PXA. The frequency of homozygous CDKN2A/B deletions in 932 mcPXA is close to 90% which exceeds the incidence of this alteration in GBM and HGAP. While very characteristic for PXA, the high frequency of homozygous CDKN2A/B deletions does not distinguish from GBM. In conclusion, we are demonstrating a high homogeneity regarding CNVs and methylation pattern in tumors receiving the methylation-based prediction mcPXA, contrasted by a high heterogeneity in histologically diagnosed PXA. Our CNV findings in mcPXA, orthogonal to the methylation class predictions, provide independent evidence for the existence of a coherent group of tumors that are unified not by their histopathology, but rather by their composite genomic and epigenomic signature. Given the demonstrated morphological heterogeneity of mcPXA tumors, this work contributes to providing an alternative for defining PXA on molecular, rather than morphological grounds. Disclosure M. Snuderl, D. Capper, M. Sill, D.T.W. Jones, S. Pfister, D. Schrimpf, F. Sahm and A. von Deimling are co-founders and shareholders of Heidelberg Epignostix GmbH. Supplementary tables
Supplementary table 1 (download)
Supplementary table 2 (download)
Supplementary table 3 (download)
Supplementary table 4 (download) References 1. Kepes JJ, Rubinstein LJ, Eng LF. 1979. Pleomorphic xanthoastrocytoma: a distinctive meningocerebral glioma of young subjects with relatively favorable prognosis. A study of 12 cases. Cancer 44:1839-52. DOI: https://doi.org/10.1002/1097-0142(197911)44:5<1839::AID-CNCR2820440543>3.0.CO;2-0 2. Giannini C, Scheithauer BW, Burger PC, Brat DJ, Wollan PC, et al. 1999. Pleomorphic xanthoastrocytoma: what do we really know about it? Cancer 85:2033-45. DOI: https://doi.org/10.1002/(SICI)1097-0142(19990501)85:9<2033::AID-CNCR22>3.0.CO;2-Z 3. WHO-Classification-of-Tumours-Editorial-Board, ed. 2021. Central Nervous System Tumours, Vols. 6. Lyon, France. 5 ed. 4. Ebrahimi A, Korshunov A, Reifenberger G, Capper D, Felsberg J, et al. 2022. Pleomorphic xanthoastrocytoma is a heterogeneous entity with pTERT mutations prognosticating shorter survival. Acta Neuropathol Commun 10:5. DOI: https://doi.org/10.1186/s40478-021-01308-1 5. Phillips JJ, Gong H, Chen K, Joseph NM, van Ziffle J, et al. 2019. The genetic landscape of anaplastic pleomorphic xanthoastrocytoma. Brain Pathol 29:85-96. DOI: https://doi.org/10.1111/bpa.12639 6. Nakamura T, Fukuoka K, Nakano Y, Yamasaki K, Matsushita Y, et al. 2019. Genome-wide DNA methylation profiling shows molecular heterogeneity of anaplastic pleomorphic xanthoastrocytoma. Cancer Sci 110:828-32. DOI: https://doi.org/10.1111/cas.13903 7. Vaubel RA, Caron AA, Yamada S, Decker PA, Eckel Passow JE, et al. 2018. Recurrent copy number alterations in low-grade and anaplastic pleomorphic xanthoastrocytoma with and without BRAF V600E mutation. Brain Pathol 28:172-82. DOI: https://doi.org/10.1111/bpa.12495 8. Capper D, Jones DTW, Sill M, Hovestadt V, Schrimpf D, et al. 2018. DNA methylation-based classification of central nervous system tumours. Nature 555:469-74. DOI: https://doi.org/10.1038/nature26000 9. Stichel D, Ebrahimi A, Reuss D, Schrimpf D, Ono T, et al. 2018. Distribution of EGFR amplification, combined chromosome 7 gain and chromosome 10 loss, and TERT promoter mutation in brain tumors and their potential for the reclassification of IDHwt astrocytoma to glioblastoma. Acta Neuropathol 136:793-803. DOI: https://doi.org/10.1007/s00401-018-1905-0 10. Weber RG, Hoischen A, Ehrler M, Zipper P, Kaulich K, et al. 2007. Frequent loss of chromosome 9, homozygous CDKN2A/p14(ARF)/CDKN2B deletion and low TSC1 mRNA expression in pleomorphic xanthoastrocytomas. Oncogene 26:1088-97. DOI: https://doi.org/10.1038/sj.onc.1209851
Copyright: © 2023 The author(s). This is an open access article distributed under the terms of the Creative Commons Attribution 4.0 International License (https://creativecommons.org/licenses/by/4.0/), which permits unrestricted use, distribution, and reproduction in any medium, provided the original author and source are credited, a link to the Creative Commons license is provided, and any changes are indicated. The Creative Commons Public Domain Dedication waiver (https://creativecommons.org/publicdomain/zero/1.0/) applies to the data made available in this article, unless otherwise stated. |